


Performance reporting is a vital component of organizational success, providing a structured way to track, analyze, and communicate progress toward set goals. By documenting key performance indicators (KPIs), it enables organizations to evaluate the efficiency of their processes and identify areas for improvement. These reports serve as a bridge between strategy and execution, ensuring that efforts align with organizational objectives. Whether in a corporate, educational, or governmental setting, performance reporting is essential for informed decision-making.
At its core, performance reporting is about transparency and accountability. Teams and leaders rely on these reports to assess productivity, resource utilization, and outcomes. The insights derived help in detecting trends, forecasting challenges, and implementing corrective measures. With regular updates, organizations can maintain agility and adapt to dynamic environments while fostering a culture of continuous improvement.
Today, the tools and techniques for performance reporting are more advanced than ever. From manual spreadsheets to automated dashboards powered by data analytics, organizations have a plethora of options to tailor reporting to their needs. These reports are not merely technical documents; they are strategic tools that empower stakeholders to measure success and recalibrate efforts. Effective performance reporting ensures that all parties remain aligned, driving collective progress toward long-term goals.
Performance reporting in project management is the process of collecting, analyzing, and communicating data about a project's progress to stakeholders. It involves tracking key metrics such as scope, budget, timelines, and resource utilization to provide a clear picture of whether the project is on track to meet its objectives.
By presenting this data in structured formats such as status reports, dashboards, or performance charts, project managers ensure transparency and facilitate informed decision-making throughout the project lifecycle. This reporting not only highlights accomplishments but also identifies potential risks and challenges early, enabling timely interventions.
Effective performance reporting fosters accountability by keeping all stakeholders aligned and aware of the project’s status. It also serves as a historical record for evaluating performance trends and refining future project strategies. When executed well, performance reporting becomes an indispensable tool for ensuring project success and building stakeholder confidence.
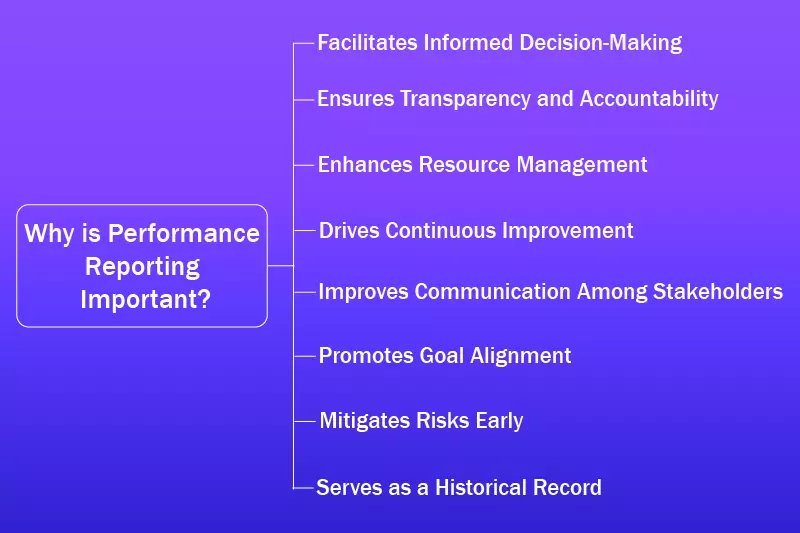
Performance reporting is crucial for ensuring the success of projects, businesses, or any organizational initiative. It provides a systematic way to evaluate progress, identify challenges, and measure achievements against set objectives. By delivering timely insights, performance reporting enables decision-makers to make informed adjustments, ensuring that goals remain attainable and aligned with strategic priorities.
This process fosters transparency, accountability, and continuous improvement across teams and stakeholders. In today’s dynamic environment, performance reporting helps organizations maintain focus and agility.
It consolidates critical data into actionable insights, allowing leaders to allocate resources effectively and optimize outcomes. Whether in project management or corporate operations, performance reporting plays a pivotal role in driving success by providing a clear roadmap for growth and improvement.

Performance reports are an essential part of project management, providing key insights into a project's progress, budget, risks, quality, and other factors that determine its success. These reports help project managers stay on track, manage resources, and communicate effectively with stakeholders.
By regularly producing and analyzing performance reports, project managers can proactively address potential problems and make adjustments to ensure the project’s goals are met. Different types of performance reports are used at various stages of the project to meet the needs of both the team and the stakeholders. The selection of a specific type of performance report depends on the information that needs to be communicated and the audience receiving it.
For example, detailed progress reports are useful for the project team, while high-level executive summaries are appropriate for senior management. Understanding the different types of reports allows project managers to choose the most effective one based on the situation, enabling better decision-making and more efficient project delivery.
A status report is a fundamental performance report that provides a snapshot of the project’s current state. It typically includes an overview of completed tasks, upcoming milestones, and the overall health of the project. It provides information about the timeline, deliverables, and any deviations from the original plan. Status reports are usually produced on a regular basis, such as weekly or bi-weekly, depending on the project's pace and the needs of stakeholders.
This report is essential for tracking whether the project is progressing as planned, both in terms of scope and schedule. It also helps identify any roadblocks or challenges that the project team is encountering, giving project managers a chance to address them before they escalate. The clarity provided by a status report helps stakeholders, including team members and executives, stay aligned on the project’s progress and makes it easier to adjust timelines or resources as needed.
A progress report is a more detailed version of a status report, often used to track specific tasks or work packages within a project. It compares the actual progress made against the planned progress and highlights any discrepancies. The report includes metrics such as the percentage of work completed, the budget spent versus the allocated amount, and the status of upcoming deliverables.
The progress report is particularly useful for identifying delays or bottlenecks early on, allowing the project manager to address issues before they become major problems. These reports may be issued weekly, monthly, or at key intervals in the project lifecycle. Since they provide a detailed analysis of work completed and ongoing tasks, progress reports are critical for project teams and stakeholders who need to understand the project’s trajectory and make informed decisions based on current performance data.
The budget and financial report are crucial for tracking the financial health of a project. This report compares actual spending to the project’s budget, helping project managers monitor costs and avoid overruns. It typically includes information on expenditures related to labor, materials, equipment, and other resources. The budget report also forecasts future spending based on current trends and project activities, providing a financial outlook for the remaining phases of the project.
Financial management is a critical aspect of any project, and budget reports help keep projects on track by preventing unexpected costs. By comparing actual vs. planned spending, project managers can identify areas where the project is overspending and take corrective actions to bring it back within budget. Additionally, the transparency provided by budget reports ensures stakeholders are informed about the financial status of the project, which can help build trust and facilitate better decision-making.
Risk management reports provide an overview of potential risks that may affect the project, including their likelihood, impact, and mitigation strategies. These reports highlight existing risks, such as technical challenges or resource shortages, and detail the steps being taken to mitigate or resolve these issues. By regularly updating risk reports, project managers can proactively manage risks and ensure the project stays on track despite uncertainties.
These reports are especially valuable for identifying issues before they occur, allowing project teams to implement corrective actions early. A risk management report not only tracks risks but also evaluates the effectiveness of risk mitigation strategies. The more accurately risks are assessed and managed, the more likely the project is to succeed. By incorporating risk management into performance reporting, project managers can make informed decisions and protect the project from unforeseen obstacles.
Quality management reports focus on ensuring the deliverables of the project meet the specified standards and customer expectations. These reports track the results of quality assurance processes, including inspections, audits, and testing. They provide an overview of how well the project’s outputs align with the defined quality criteria and identify areas where quality issues may arise.
By using quality management reports, project managers can ensure that the project’s outputs meet the required quality standards and minimize the risk of defects or rework. The report provides transparency into the effectiveness of quality control measures and highlights any corrective actions taken. These reports are critical in maintaining stakeholder satisfaction and ensuring that the project delivers a high-quality product or service. They help minimize the risk of costly errors and build trust with customers and other stakeholders.
Variance reports are essential for tracking the difference between the planned and actual performance of a project. These reports identify discrepancies in areas such as cost, time, and scope, helping project managers understand why a project is deviating from its original plan. Variance reports may focus on different aspects of performance, such as schedule variances (SV), cost variances (CV), or scope variances (SV).
By providing insights into performance gaps, variance reports help project managers take corrective actions to address issues early. These reports are critical for maintaining control over the project and ensuring that it stays aligned with the original plan. By highlighting where deviations are occurring, variance reports also help identify the root causes of issues, enabling more effective decision-making and resource allocation to get the project back on track.
An executive summary report provides a concise, high-level overview of the project's performance, often tailored for senior stakeholders or executives. The report typically includes key performance indicators (KPIs), overall progress, budget status, and a summary of major risks or issues. Executive summary reports are designed to be brief and to the point, offering decision-makers the information they need without getting into detailed data.
These reports are especially useful for busy executives who need to stay informed about the project’s status but do not require in-depth analysis. By focusing on critical information, executive summary reports provide stakeholders with a clear understanding of the project’s health, enabling them to make strategic decisions. Regular executive summaries help keep leadership aligned and allow for quick interventions if necessary, ensuring that the project remains on course.
A team performance report evaluates the efficiency and productivity of the project team. This report tracks the contributions of individual team members, identifies areas for improvement, and highlights any performance gaps. It may include metrics such as task completion rates, individual goals achieved, and team collaboration scores. Team performance reports provide insight into how effectively the team is working together and whether additional support or training is needed.
By using these reports, project managers can address any issues related to team performance early on. Whether the team is facing challenges with collaboration, communication, or task completion, these reports help project managers identify areas that need improvement. Monitoring team performance is crucial for ensuring the project runs smoothly and that all team members are contributing effectively to the project’s success. These reports also help foster a culture of accountability and continuous improvement within the project team.
A milestone report focuses on tracking significant project milestones and deliverables. It provides updates on whether key phases or tasks have been completed on time and within the planned budget. Milestones can include project initiation, design phase completion, final testing, or delivery of the product. This report is essential for measuring the progress of a project and ensuring that it is on track to meet key deadlines.
Milestone reports are critical for large projects with multiple phases, as they allow stakeholders to track progress toward key objectives. By tracking milestones, project managers can identify whether the project is on schedule and adjust resources or timelines if necessary. These reports are especially useful for communicating progress to clients and senior management, ensuring that everyone is aligned and aware of the project's current state.
A post-project report is conducted after the project has been completed to assess its overall success. It includes an evaluation of how the project performed against its objectives, budget, and timeline. The report often highlights lessons learned, both positive and negative, and provides recommendations for future projects. This type of report serves as a tool for reflection and improvement.
Post-project reports help organizations improve their project management processes by identifying what went well and what could be improved. By reviewing the project’s overall performance, teams can enhance their approach to future projects, preventing the same mistakes and reinforcing successful strategies. This report also contributes to knowledge sharing within the organization, ensuring that best practices are carried forward and applied to new initiatives.
Performance reporting is a vital tool for monitoring progress, aligning efforts, and driving success in any project or organization. It enables stakeholders to evaluate key metrics, track deliverables, and identify challenges proactively.
By providing timely insights, it supports data-driven decision-making and helps maintain a clear focus on achieving objectives efficiently. Beyond tracking outcomes, performance reporting contributes to long-term growth and sustainability.
It promotes transparency, accountability, and strategic alignment, ensuring all stakeholders stay informed and engaged. Additionally, performance reporting lays the groundwork for continuous improvement by offering actionable insights that refine processes and boost overall performance.

Effective project performance reports are critical tools for project managers to monitor progress, manage risks, and ensure that project goals are being met. These reports help communicate important project data, identify potential issues early, and provide a clear view of the project’s health.
An effective report not only tracks current performance but also offers a roadmap for decision-making and strategy adjustments. To ensure that the reports are informative, actionable, and clear, certain elements need to be included. A well-constructed performance report should be concise yet comprehensive, providing a balanced mix of qualitative and quantitative data.
It should be tailored to meet the specific needs of the stakeholders, whether they are project teams, clients, or executives. The following elements are fundamental to creating a performance report that facilitates informed decision-making and supports project success. Each element serves a unique purpose, contributing to a detailed and thorough understanding of the project’s status and trajectory.
A key element of an effective performance report is a clear understanding of the project objectives and scope. The report should explicitly outline the project’s goals and deliverables, ensuring that all stakeholders are aligned on what the project aims to achieve. The scope must be well-defined, and any deviations from it should be immediately highlighted. By providing clarity on the objectives and scope, the report ensures that performance is evaluated against the original targets, making it easier to track progress.
Defining the project’s objectives and scope in the report helps ensure that all stakeholders are on the same page. It sets a baseline for comparing actual performance against planned expectations, helping the project manager and the team stay focused on the end goals. This section also provides context for the rest of the report, showing whether any changes or deviations to the scope have occurred and whether they have had an impact on the overall progress.
Key Performance Indicators (KPIs) are measurable values that demonstrate how effectively a project is achieving its objectives. Including KPIs in the report helps project managers and stakeholders quickly assess the project’s performance in critical areas such as cost, time, quality, and scope. Common KPIs may include budget variance, schedule variance, resource utilization, and customer satisfaction. KPIs provide clear, actionable metrics that can help identify areas for improvement.
Including KPIs allows project managers to track the progress of specific aspects of the project. They provide quantifiable data that highlight where the project is meeting or falling short of expectations. A project’s success can be more accurately measured when these indicators are monitored regularly. By incorporating these KPIs into performance reports, stakeholders can easily see the project’s alignment with the original objectives, which helps in making informed decisions about corrective actions when necessary.
A detailed evaluation of the project’s progress against the planned schedule is essential in any performance report. This section should compare the planned timelines with actual completion dates, highlighting any delays or deviations. By assessing the schedule, the report helps identify whether the project is on track, ahead, or behind. If any critical tasks have been delayed, the reasons for the delays and the impact on the overall timeline should also be addressed.
By tracking progress against the schedule, project managers can manage expectations and allocate resources effectively. This section provides stakeholders with a clear understanding of where the project stands concerning timelines. If delays occur, this section can suggest corrective measures, such as resource reallocation or task prioritization, to bring the project back on track. Furthermore, it helps prevent schedule overruns by identifying issues early, allowing for timely interventions, and reducing the risk of missing critical deadlines.
Financial performance is one of the most crucial elements in project performance reporting. A financial overview should be included in the report, detailing the actual expenditures compared to the project’s budget. It should include a breakdown of costs such as labor, materials, equipment, and other expenses. By comparing budgeted costs to actual spending, project managers can identify potential financial issues and make necessary adjustments to avoid budget overruns.
A detailed budget section in the performance report helps stakeholders understand the financial health of the project. It allows for early identification of any areas where costs are exceeding expectations, enabling corrective actions to be taken before financial problems escalate. Furthermore, this section helps ensure that the project stays within its allocated budget, supporting financial accountability. It also aids in making informed decisions about cost-cutting measures or reallocation of resources, ensuring the project remains financially viable throughout its lifecycle.
An effective performance report must include an assessment of the risks and issues facing the project. This section should outline any identified risks, their potential impact, and the steps being taken to mitigate them. In addition, it should track existing issues, such as delays or quality concerns, and provide solutions or updates on how they are being addressed. Regularly updating the report on risks and issues ensures that project managers are proactive in mitigating problems and keeping the project on course.
By including a risk management section, the performance report highlights any threats to the project’s success and ensures that appropriate actions are being taken. This proactive approach allows for early interventions, reducing the chances of significant disruptions down the line. Tracking both risks and issues provides a comprehensive view of the challenges facing the project, allowing stakeholders to make well-informed decisions and allocate resources effectively to mitigate these challenges and safeguard the project’s success.
Quality assurance and control are essential elements of project performance reporting. This section assesses whether the project’s outputs meet the defined quality standards. It should provide details on quality checks, tests, and any inspections that have been carried out, highlighting areas where quality issues have been identified and the actions taken to address them. This element ensures that the project’s deliverables are not only completed on time and within budget but also meet the required quality criteria.
Incorporating quality management in performance reports is crucial for ensuring that the project delivers what was promised to clients or stakeholders. A strong focus on quality helps prevent the need for costly rework and ensures customer satisfaction. By tracking quality metrics and implementing corrective actions, project managers can ensure that defects or issues are identified early, allowing for quick resolution. This section also supports continuous improvement within the team, fostering a culture of excellence throughout the project.
Another important aspect of a performance report is the inclusion of stakeholder communication and feedback. This section should summarize key communications with stakeholders, including meetings, presentations, and any feedback received. It helps ensure that the project manager is keeping stakeholders informed and involved throughout the project. Additionally, feedback should be reviewed to ensure any concerns or suggestions are addressed in a timely manner.
Effective stakeholder communication is vital for maintaining alignment and transparency throughout the project. This section ensures that stakeholders have a clear understanding of the project’s progress, as well as any challenges that have arisen. By including feedback and communication details in the performance report, project managers can foster strong relationships with stakeholders, improving overall project support and satisfaction. Regular updates allow for timely interventions, adjustments, and a better understanding of stakeholder concerns, contributing to the project’s ultimate success.
The final element of an effective performance report is a section dedicated to action items and recommendations. Based on the data presented, this part of the report should outline the next steps and any corrective actions that need to be taken. It should detail tasks or adjustments required to address challenges or improve performance, ensuring that the project remains on track to meet its objectives.
Including action items and recommendations in the report ensures that all team members and stakeholders know what is expected of them moving forward. It provides clear guidance on how to address issues and keep the project on course. Furthermore, this section ensures accountability by assigning responsibilities for specific actions. By incorporating recommendations, the performance report becomes a tool for continuous improvement, helping to refine processes and strategies that drive the project toward its successful completion.
Creating effective performance reports is an essential skill for project managers to track project progress, address issues, and ensure successful project completion. These reports provide a comprehensive overview of the project's status, offering valuable insights that help stakeholders make informed decisions. An effective report not only tracks progress but also identifies areas of concern and suggests solutions for improvement.
When creating performance reports, it is crucial to include relevant data, maintain clarity, and ensure that the report is tailored to the audience’s needs. A well-crafted performance report involves several critical steps, including data collection, setting objectives, identifying key performance indicators (KPIs), analyzing data, and presenting the findings in an organized format.
By following a systematic process, project managers can create reports that effectively communicate project performance, highlight issues, and offer actionable insights. The following steps outline the process of creating performance reports and ensuring that they meet the expectations of all involved stakeholders.
Before creating a performance report, it’s essential to define its objectives and identify the intended audience clearly. The objectives will guide the report’s focus, ensuring that it addresses the right areas, such as project progress, budget, or resource allocation. Understanding the audience is equally important, as it influences the level of detail, language, and format of the report. For example, an executive summary is ideal for senior management, while a more detailed, data-driven report may be necessary for the project team.
Once the objectives are clear, the report can be structured to highlight the most critical aspects of the project. For instance, if the focus is on resource utilization, the report will include data on team performance, resource allocation, and any resource-related issues. By tailoring the report to meet the needs of the audience, project managers ensure that stakeholders receive the most relevant and useful information, making it easier to make decisions and take action.
The next step in creating a performance report is to gather relevant data and metrics. This involves collecting quantitative and qualitative information that reflects the project’s progress. Metrics such as schedule adherence, cost variance, task completion rates, and resource utilization are essential in evaluating performance. Project managers may also need to include non-numeric data, such as team feedback, quality assessments, and risk evaluations, depending on the project’s scope.
Data collection should be systematic and accurate, ensuring that the information reflects the actual performance of the project. It’s important to source data from reliable systems, such as project management tools, financial reports, and stakeholder feedback. By gathering comprehensive data, the performance report provides an accurate picture of the project’s status, helping stakeholders understand the project’s progress and challenges. Inaccurate or incomplete data can lead to misinterpretations and poor decision-making, so thorough data collection is key to effective reporting.
Key Performance Indicators (KPIs) are essential for evaluating project success and progress. KPIs should be selected based on the specific objectives of the report and the project’s goals. For instance, if the project’s primary goal is to be completed within budget, KPIs related to cost control, such as budget variance or cost performance index, should be prioritized. Other common KPIs include schedule performance, resource efficiency, and stakeholder satisfaction. The KPIs chosen should directly reflect the most critical factors that contribute to the success of the project.
Once KPIs are identified, they should be tracked throughout the project’s lifecycle and included in the performance report. These indicators help provide a clear, quantitative measure of how well the project is performing in key areas. In addition to tracking actual performance, the report should also include any trends or patterns in the KPIs, providing insight into potential risks or areas that may need improvement. By focusing on the right KPIs, project managers can ensure that their performance reports highlight the most relevant aspects of the project.
Analyzing and interpreting the collected data is a crucial step in creating performance reports. This step involves comparing the data against pre-established goals, KPIs, or benchmarks to assess the project’s performance. For example, if the project is behind schedule, the report should include an analysis of the causes of delays, such as resource shortages, unforeseen issues, or scope changes. Similarly, if the project is under budget, the report should explain how resources are being managed efficiently.
The analysis should not be limited to just identifying problems; it should also highlight successes and areas where the project is performing well. By analyzing the data, project managers can uncover insights that may not be immediately apparent from raw data alone. The interpretation of the data helps stakeholders understand the reasons behind the project’s performance, allowing for more effective decision-making. It also enables project managers to recommend corrective actions or adjustments that can improve project outcomes.
Once the data has been analyzed, it’s important to present the findings in a clear, structured format. The report should be organized logically, with sections for project objectives, KPIs, data analysis, risk assessments, and recommendations. A common structure includes an executive summary, detailed sections on performance metrics, and a conclusion or recommendations for action. The layout should be easy to navigate, with headings, bullet points, and charts to enhance readability.
Visual elements such as graphs, charts, and tables can make complex data easier to understand and digest. For example, a Gantt chart can show schedule performance, while a bar chart can illustrate budget variance. Visual aids help to break up the text and provide a more engaging way of presenting information. The report should also include a section for action items or recommendations, guiding stakeholders on the next steps. A well-organized and visually appealing report ensures that key insights are communicated effectively.
In any performance report, it’s important to identify and highlight risks and issues that may affect the success of the project. This section should outline any challenges, delays, or concerns that have emerged since the last report. It may include problems such as resource shortages, stakeholder concerns, or changes in project scope. By addressing these issues head-on, the report provides a clear view of potential threats to the project’s success and the steps being taken to mitigate or resolve them.
This section also provides context for decision-making. If there are significant risks or issues, the report should propose solutions or actions to address them. For instance, if a project is behind schedule due to resource issues, the report may recommend hiring additional resources or reassigning tasks. Addressing risks and issues in the report helps ensure that the project stays on track and that stakeholders are informed of any challenges. A proactive approach to risk management in performance reports increases the likelihood of successfully managing the project’s trajectory.
The final step in creating a performance report is to include actionable insights and recommendations. Based on the data analysis and identified risks, the report should guide the next steps for the project. This could include suggestions for improving performance, adjusting timelines, reallocating resources, or implementing new strategies. Actionable insights help stakeholders understand how to address issues and ensure that the project continues to move forward efficiently.
Recommendations should be specific and clear, providing concrete actions that can be taken to improve the project’s performance. For example, if a project is facing delays due to inefficiencies in the process, the report may suggest streamlining workflows or adopting new tools to enhance productivity. By offering actionable recommendations, the performance report becomes a tool for continuous improvement, helping project managers and teams optimize their efforts and achieve project goals. Providing these insights ensures that the project manager and stakeholders have a clear path forward.
After drafting the performance report, the final step is to review and finalize it before distribution. This process involves checking the accuracy and completeness of the data ensuring that all relevant metrics and information are included. It’s also important to verify that the language is clear and concise without any ambiguity. The report should be free from errors, ensuring that it provides reliable information to stakeholders.
Once the review process is complete, the report can be finalized and shared with the relevant stakeholders. Depending on the project’s complexity, this may involve presenting the report in meetings or distributing it electronically for review. Ensuring that the report is polished and professional reflects the project manager’s attention to detail and commitment to transparency. A finalized performance report ensures that all stakeholders are informed and can make data-driven decisions to move the project forward.
Performance reporting is crucial for ensuring that teams, managers, and organizations can assess progress, understand project dynamics, and make informed decisions. A well-executed report provides a snapshot of performance, highlights areas that need attention, and helps in setting the direction for improvements.
By following best practices, reports can effectively guide strategies, enhance communication, and support continuous improvement. These best practices ensure reports are clear, impactful, and relevant for the target audience, facilitating accountability and decision-making. In order to maximize the value of performance reports, it's important to integrate clarity, simplicity, and strategic focus.
The reports should not only convey data but also provide actionable insights that stakeholders can use to adjust strategies. Effective performance reporting requires attention to detail, understanding the needs of different stakeholders, and ensuring that the right information is provided at the right time. By adhering to best practices, reports will become a key tool for monitoring and improving performance outcomes.
Creating effective performance reports is crucial for monitoring the progress of a project, assessing risks, and communicating with stakeholders. Project managers rely on tools that simplify the reporting process and provide real-time data, allowing them to make informed decisions.
The best performance reporting tools combine data visualization, collaboration features, and robust analytics to ensure that the report is comprehensive and easy to understand. These tools also support various project management methodologies, such as Agile or Waterfall, to cater to the needs of different teams and projects. Selecting the right tool for performance reporting can significantly enhance the quality of reports and improve decision-making processes.
With a variety of options available, ranging from simple dashboards to advanced reporting software, understanding the capabilities of each tool is essential. Below are some of the top tools that can help project managers create efficient and insightful performance reports. These tools provide valuable features such as customizable templates, real-time updates, and integration with other project management platforms.

Microsoft Power BI is one of the most popular tools for creating performance reports due to its advanced data visualization capabilities and integration with various data sources. The tool allows users to import data from multiple platforms, such as Excel, SharePoint, and SQL databases, and turn them into interactive reports and dashboards. With Power BI, project managers can create customized visualizations, making it easy to present complex data in an accessible format.
In addition to its impressive data visualization features, Power BI also supports real-time data updates, ensuring that performance reports reflect the most current information. The tool’s easy-to-use interface and robust analytics features help project managers analyze project performance, identify trends, and make data-driven decisions. Furthermore, Power BI integrates seamlessly with other Microsoft products, such as Office 365, SharePoint, and Teams, allowing for collaborative reporting and easier data sharing. These features make Power BI a powerful tool for creating comprehensive performance reports.

Tableau is another highly regarded data visualization tool that helps create performance reports with ease. It is known for its interactive dashboards and a wide range of visualization options. Project managers can connect Tableau to various data sources, such as cloud storage, databases, and spreadsheets, allowing them to pull in data from different platforms. The tool’s drag-and-drop functionality makes it simple to create visually appealing reports that are easy to understand.
One of Tableau’s standout features is its ability to analyze large datasets and create real-time dashboards. This is especially useful for performance reporting, as project managers can monitor key performance indicators (KPIs) in real time. The tool also provides advanced analytics capabilities, such as predictive analysis and trend forecasting, which can help identify potential issues and opportunities in the project. Tableau’s user-friendly interface and ability to create interactive visualizations make it an ideal tool for creating insightful performance reports.

Smartsheet is a versatile tool for project management that includes performance reporting features. It combines the functionality of spreadsheets with collaboration tools, allowing project managers to create performance reports with real-time updates and project tracking. Smartsheet offers customizable templates for performance reports, making it easier for project managers to generate reports without starting from scratch.
In addition to its reporting capabilities, Smartsheet allows for easy collaboration among team members. Users can share reports, track project progress, and provide feedback directly within the platform, enhancing communication and decision-making. Smartsheet also integrates with a variety of other tools, including Google Drive, Microsoft Office, and Salesforce, enabling seamless data import and export. With its ability to create dynamic reports and manage projects efficiently, Smartsheet is an excellent choice for performance reporting.

Google Data Studio is a free tool that allows project managers to create customizable and interactive performance reports. It connects with a variety of data sources, including Google Analytics, Google Sheets, and Google Ads, as well as other third-party platforms. With its intuitive drag-and-drop interface, users can design performance reports that feature charts, tables, and graphs to represent data in a visually engaging way.
One of the key advantages of Google Data Studio is its collaboration features. Multiple team members can work on the same report simultaneously, making it easy to share insights and collaborate in real-time. The tool also provides customizable templates, allowing project managers to create reports that match their specific needs. Google Data Studio is a great option for teams already using Google’s ecosystem, as it integrates seamlessly with other Google tools, providing a unified platform for performance reporting.

Asana is a popular project management tool that offers performance reporting features to help teams track their progress. The tool provides dashboards where project managers can monitor key metrics, such as task completion, deadlines, and project milestones. With Asana, project managers can create visual reports that display real-time data, allowing them to track project performance and identify areas that need attention.
Asana also allows for easy collaboration with features such as task comments, file sharing, and team messaging. Users can generate reports that highlight project performance against set KPIs and milestones, making it easier to assess progress and identify potential roadblocks. Additionally, Asana integrates with other tools like Microsoft Teams, Slack, and Google Drive, making it easy to pull in data from multiple platforms for comprehensive performance reporting.

ClickUp is a project management platform that includes performance reporting features such as customizable dashboards, goal tracking, and detailed analytics. Project managers can use ClickUp to create performance reports that track metrics like task completion rates, project timelines, and resource allocation. The tool allows users to generate both real-time and historical reports, offering a comprehensive view of project performance.
ClickUp’s unique reporting features include the ability to create task-based performance reports that focus on specific tasks and goals. This level of detail helps project managers identify areas where teams may be underperforming and take corrective action. Additionally, ClickUp supports integrations with other tools like Google Drive, Slack, and Zapier, providing a centralized platform for tracking and reporting project performance. With its customizable features and powerful reporting capabilities, ClickUp is an excellent choice for managing and reporting on project performance.

Monday.com is a highly flexible project management tool with strong performance reporting capabilities. It allows project managers to create performance reports that track key metrics, such as task completion rates, timelines, and resource usage. Monday.com’s dashboard feature enables users to visualize project data through graphs, charts, and tables, making it easy to monitor progress and assess performance.
One of the notable features of Monday.com is its customizable reporting templates, which allow project managers to tailor reports to meet the specific needs of their projects. The tool also supports real-time updates, ensuring that performance reports always reflect the latest project data. In addition to performance tracking, Monday.com facilitates team collaboration with features such as task assignments, comments, and file sharing. Its integration capabilities, including tools like Slack, Microsoft Teams, and Google Drive, make Monday.com an ideal choice for creating comprehensive performance reports.

Zoho Analytics is a robust business intelligence tool that supports the creation of detailed performance reports. It offers a wide range of data connectors, enabling project managers to pull data from multiple sources such as CRM systems, cloud storage, and spreadsheets. With its powerful reporting and analytics features, Zoho Analytics allows users to create detailed performance reports, including KPIs, trend analysis, and comparison charts.
The tool also provides advanced data analysis capabilities, such as predictive modeling and cohort analysis, to help project managers understand past performance and forecast future trends. Zoho Analytics integrates with a variety of other Zoho products, as well as third-party tools like Google Analytics, QuickBooks, and Microsoft Office. This makes it an ideal choice for project managers who need to gather data from multiple platforms and create comprehensive, actionable performance reports.

Performance reporting plays a pivotal role in tracking the status of a project and providing actionable insights for improvement. A well-structured report helps project managers, stakeholders, and team members assess the project's health and its alignment with organizational goals. It highlights the key performance metrics and provides a clear view of areas that need attention or adjustment.
Each component of the report contributes to a comprehensive understanding of the project's progression. For an effective performance report, it’s crucial to include components that cover various aspects of the project’s progress, health, and potential challenges.
These components ensure that the report serves its purpose of offering valuable insights, making it easier to communicate with stakeholders and take corrective actions when necessary. Here are the key components to include in any performance report for a successful project management strategy.
Project managers play a vital role in enhancing performance reporting by ensuring that the reports accurately reflect the project’s progress and align with business goals. By closely monitoring key performance indicators (KPIs), project managers can identify performance gaps, highlight successes, and detect potential risks early. Their deep understanding of project dynamics and team capabilities allows them to provide meaningful context within reports, transforming raw data into actionable insights.
When project managers take an active role in shaping performance reports, they ensure that the content is both relevant and tailored to the needs of stakeholders, thereby improving the overall effectiveness of the report. Moreover, project managers are instrumental in creating a feedback loop that drives continuous improvement in performance reporting.
By engaging with stakeholders and understanding their needs, project managers can refine reporting processes, ensuring that reports meet expectations and contribute to decision-making. They can also identify trends, make adjustments to reporting formats, and align the reports with evolving project goals. Through effective communication and collaboration, project managers can foster a culture of transparency, accountability, and data-driven decision-making, ultimately enhancing the quality and impact of performance reports.
Performance reporting is an essential tool for monitoring progress, making informed decisions, and driving improvements in project and organizational outcomes. By adhering to best practices such as focusing on relevant metrics, using clear visualizations, and tailoring reports to stakeholders, performance reporting can offer valuable insights that guide action.
When project managers take an active role in shaping and refining reports, they help ensure that the data is meaningful and impactful. Ultimately, effective performance reporting enhances accountability, transparency, and efficiency, contributing to the overall success of projects and the achievement of organizational goals.
Copy and paste below code to page Head section
Performance reporting in project management involves tracking and documenting the progress of a project by measuring key metrics. It provides stakeholders with valuable insights into project success, identifying potential risks, challenges, and achievements. The goal is to ensure that project objectives are met on time and within budget.
Performance reporting is crucial for maintaining transparency, accountability, and data-driven decision-making. It helps project managers identify areas needing improvement, monitor the effectiveness of strategies, and communicate progress to stakeholders. Timely and accurate performance reports enable adjustments to be made for better project outcomes.
To create a performance report, first define the key metrics to measure success, such as KPIs. Gather data, present it using charts and graphs, analyze trends, and highlight key insights. Tailor the report to the audience, ensuring it’s concise and actionable, and include recommendations for improving performance when necessary.
A performance report should include key performance indicators (KPIs), progress toward project goals, resource utilization, challenges, and recommendations. Visualizations such as graphs and tables can help present data clearly. The report should also include an executive summary for quick insights and any action items required for improvement.
The frequency of performance reports depends on the project scope and timeline. For large projects, monthly or quarterly reports are sufficient, while smaller, more fast-paced projects require weekly reports. Consistent reporting allows for better tracking of progress and timely identification of issues.
Project managers are typically responsible for performance reporting. They gather data, analyze progress, and communicate the results to stakeholders. However, depending on the organization, other team members, such as business analysts or department heads, may assist in data collection or report generation.


